Wolfram Schrimpf, Jean-Noël Druon, Srdjan Dobricic and Adolf Stips
European Commission-Joint Research Centre
Institute for Environment & Sustainability
Inland & Marine Waters Unit
Ispra (VA)
Italy
Extended abstract
Introduction
Eutrophication may be described as pollution resulting from an excess of nitrates
and phosphates discharge that leads to disturbances of the ecosystem such as
a shift in the natural species composition or oxygen deficiency near the bottom.
Eutrophication is a major problem in most of the European regional seas including
the Mediterranean and the Black Sea (EEA 1999, EEA 2000, Lancelot et al. 2002).
The Mediterranean Sea is one of the most oligotrophic seas in the world and
the problem of eutrophication appears to be limited largely to specific coastal
and adjacent offshore areas where several, and occasionally severe eutrophication
events occur. This is the case in the Northern Adriatic Sea which receives anthropogenically-enhanced
nutrient loads mainly from the Po River. A warm summer, strong stratification
during this period and no tidal mixing form favourable conditions for the negative
effects of eutrophication. There is in the first place severe oxygen depletion
in the water column and as a result the benthic fauna and flora in the affected
areas may totally though temporarily disappear.
Eutrophication in the Black Sea, a phenomenon occurring over wide areas of the basin, should be of concern to the bordering countries. More than 50% of the input of nutrients in the Black Sea originates from the Danube river. Eutrophication has changed considerably the composition of fauna and flora in this regional sea. Many of the fish and sea mammals at the top of the chain have disappeared while intruder species increase. In the early 90s Danube phosphorus and nitrogen loads to the Black Sea decreased considerably compared to peak values observed in the late 80s corresponding to the socio-economical decline since 1991. A recovery of the economies of Central and Eastern European countries might therefore have dramatic consequences for the Black Sea environment if no adequate environmental policy measures among Danube countries are taken.
Eutrophication indices supporting monitoring and assessment of marine ecosystems
The eutrophication process is clearly tackled in existing and developing EU water policies and legislation (e.g. Nitrates Directive, Urban Wastewater Treatment Directive, and European Marine Policy). The Maastricht and Amsterdam Treaties have reinforced the applicability of the Directives and the awareness of “sustainable development”, the principles of “precaution” and “prevention at source”. At the same time the various Regional Marine Conventions (OSPAR, HELCOM, Bucharest, Barcelona) consider the combating of eutrophication as one of the major objectives to fulfil. Hence, routine monitoring and assessment of the physical and biological conditions in coastal marine ecosystems has become a major task for the Regional Marine Conventions.
Tools for monitoring of eutrophication are the classical in-situ measurements
of the relevant physical and biological variables but also information derived
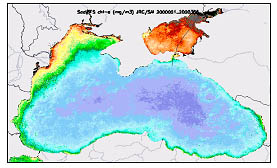
from satellite remote sensing imagery (for an example see Fig. 1) can help to
better understand the spatial component of coastal marine biological processes
through the synoptic view provided for the near surface layer of the water column.
Today, the definition of eutrophication has broadened and includes the diversity
of the disturbances, the complexity of interactions within variously sensitive
ecosystems, as shown by the latest OSPAR definition in 1998: “’Eutrophication’
means the enrichment of water by nutrients causing an accelerated growth of
algae and higher forms of plant life to produce an undesirable effects resulting
from anthropogenic enrichment by nutrients”. The implementation of policies
such as the latest and comprehensive Water Framework Directive is dependent
on the capacity of ecological indicators to capture the complexities of the
ecosystem, yet remain simple enough to be easily and routinely monitored. Numerous
developments have been made to derive eutrophication indicators and indices.
However, these indices are either region-specific (biotic criteria) or incomplete
(physical sensitivity) and all are geographically restricted (i.e. applied at
the scale of a bay or an estuary) due to the necessary input of in situ measurements
at the appropriate frequency. Hence, an urgent need for the harmonization of
criteria and indices at the European scale is expressed by decision-makers and
the scientific community in view of a comparison of the status and trends of
eutrophication.
Two spatial eutrophication indices of shallow marine ecosystems have been developed, based on 3D hydrodynamic modelling data and satellite remote sensing data of ocean colour (Druon et al 2002). The Physically Sensitive Area index (PSA) integrates the various supporting factors of eutrophication, i.e., the physical conditions that influence the primary production in the upper layer and the oxygen availability near the sea bottom. The PSA index portrays the location of potential oxygen deficiencies if both the nutrient distribution and the primary production are uniformly distributed. The EUTrophication RISK index (EUTRISK) represents the spatial distribution of potential hypoxia for a given month integrating the physical supporting factors and the flux of organic matter estimated from satellite-derived chlorophyll-a maps, with an oxygen budget estimated on a monthly basis. The PSA and EUTRISK indices identify three main types of eutrophied waters: 1) eutrophic and sensitive, 2) eutrophic and resistant and 3) mesotrophic and sensitive. Category 1 is where the oxygen depletion occurs regularly because both the main pressure and supporting factors are unfavourable (e.g. coastal waters south of the Pô river mouth). Category 2 depicts areas where there is no severe hypoxia near the sea bed because of a permanent tidally-induced vertical mixing, but where the loss of biodiversity and the appearance of opportunist species are generally observed (e.g. Bay of Seine and Wash Embayment). In category 3, severe hypoxia or anoxia are reported due to particularly adverse physical conditions even if the primary production is relatively low (e.g. Kattegat and north of 450N in the Adriatic Sea). An example of PSA and EUTRISK is shown in Fig. 2 for the Adriatic Sea.
The PSA and EUTRISK indices assess the ecosystem sensitivity and status with regard to eutrophication, its trend over time, and are to be applied on a European scale. The various types of shallow marine ecosystems submitted to eutrophication separated by EUTRISK and PSA are: hypertrophic and sensitive (recurrent anoxia), hypertrophic and resistant (only exceptional severe hypoxia), hypertrophic and hyper-resistant (light hypoxia), eutrophic and sensitive (aperiodic anoxia or severe hypoxia), and finally mesotrophic and hyper-sensitive (recurrent anoxia). Even the types of eutrophied ecosystem which do not suffer from severe hypoxia are subject to a significant loss of biodiversity leading to the appearance of blooms of toxic or nuisance algae.
Conclusions
The PSA and EUTRISK indices constitute an ecological tool for policy managers from the Regional level to the European level. The first promising results aimed to test the robustness of the approach. The extension to all European shallow marine systems will allow a comparison of eutrophication types and intensity as well as their evolution in time. It also should attempt to fill the gap in areas where the research effort on eutrophication is relatively poor (Vidal et al. 1999). It should help the scientific community to focus on areas of particular interest and to guide their sampling strategy.
The indices also show where best to invest efforts for restoration and help to estimate the cost for rehabilitating towards the pristine ecological status. This approach to marine eutrophication provides an answer to a fragment of the Phase III conceptual model shown in the excellent review of Cloern (2001). The latter concept includes multiple stressors, a filter that modulates the ecosystem responses, the multiple responses themselves, the impacts on the Earth System including aspects that influence sustainability of the human population, and scientifically sound tools for building rational management strategies.
PSA and EUTRISK focus on the main stressor of eutrophication, i.e., nutrient enrichment and include the physical environment as a filter, and provide a large scale and temporal view of the major ecosystem responses, i.e., the production of organic matter and the oxygen budget. The quantitative assessment of the mechanisms involved allows the estimate of the relative cost for restoration that is a prerequisite for building efficient management strategies.
References
Cloern, J.E., 1999, The relative importance of light and nutrient limitations
of phytoplankton growth: a simple index of coastal ecosystem sensitivity to
nutrient enrichment. Aquatic Ecology, 33, 3-16.
Druon, J.-N., W. Schrimpf, S. Dobricic and A. Stips, 2002, The physical environment
as a key factor in assessing the eutrophication status and vulnerability of
shallow Seas: PSA & EUTRISK (v1.0), European Commission, Report EUR 20419
EN,
EEA, 1999, State and pressures of the marine and coastal Mediterranean environment,
European Environment Agency, Environmental assessment series No. 5.
EEA, 2000, Environmental signals 2000, European Environment Agency, Environmental
assessment report No. 6.
Lancelot, C., J.-M. Martin, N. Panin and Y. Zaitsev, 2002, The North-west Black
Sea: A pilot site to understand the complex interaction between human activities
and the coastal environment, Estuarine, Coastal and Shelf Science, 54, 279-283.
Vidal, M., Duarte, C.M., and Sánchez, M.C., 1999, Coastal eutrophication
research in Europe: progress and imbalances, Marine Pollution Bulletin, 38,
851-854.
Fig. 1: Spring-summer mean chlorophyll-a concentration (2000) for the Black Sea derived from SeaWiFS satellite data (low chl-a concentration – blue, high chl-a concentration- red).
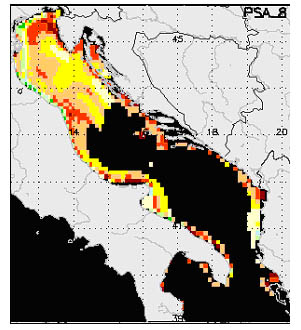
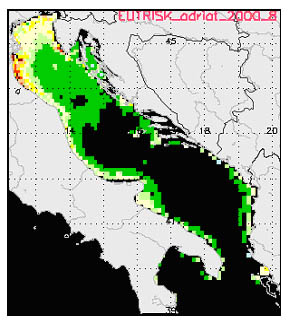
Fig 2: Physical sensitive area index to eutrophication, PSA,
based on 3D hydrodynamic modelling results in the Adriatic Sea (upper
map). This index represents the physical sensitivity to eutrophication
(high towards red) due to the physical conditions. In black are the areas not
covered by the model or deeper than 100m. Eutrophication risk index. EUTRISK
based on 3D hydrodynamic modelling results and remote sensing of ocean colour
in the Adriatic Sea in August 2000 (lower map). The Eutrisk
index represents the most probable oxygen deficiency distribution near the sea
bottom for the considered month. In black are the areas not covered by the model
or water deeper than 100m.